Data description/conditions

Contents
Specification of stress-strain relation of pipe material (Input Table)
Data description/conditions:
MATREF:
Reference name of material data
Unique name in list
Rm:
Ultimate tensile strength
> 0. / Undefined
SIGEPS:
Type of stress-strain relation (diagram)
Undefined / Prescribed names: Bilinear, Ductile, DS-Hardening, Cyclic
(If Undefined (empty), the Bilinear diagram is applied in case of material non-linear calculations.
Bilinear = Bilinear stress-strain relation
Ductile = Ductile stress-strain relation
DS-Hardening = Ductile stress-strain relation with Strain Hardening
Cyclic = Stress-strain relation under cyclic loading
See below for further description.)
K-VALUE:
(cyclic) hardening coefficient
> 0. if SIGEPS = CYCLIC / Undefined
N-VALUE:
(cyclic) hardening exponent
> 0. if SIGEPS = CYCLIC / Undefined
CHKEPS:
Check strain of pipe material
> 0. / Undefined
(If Undefined (empty), the value is set to 7 or 5 permil (see NEN 3650-2). This strain is considered to be an allowable strain in case of material non-linear analysis. If exceeded, a warning is given.)
The diagram for the stress-strain relation can be described approximately by an analytical function, for cyclic loading by the equation:
e = s/E + (s/K)**(1/N)
where:
e = strain
s = stress
E = Young's modulus
K = hardening coefficient
N = hardening exponent
Built-in stress-strain relations:
BILIN Stress-Strain diagram |
DUC Stress-Strain diagram |
DSH Stress-Strain diagram |
|||
Strain / |
Stress / |
Strain / |
Stress / |
Strain / |
Stress / |
0.000 |
0.000 |
0.000 |
0.000 |
0.667 |
0.667 |
1.000 |
1.000 |
0.450 |
0.450 |
0.926 |
0.800 |
~ |
1.000 |
0.650 |
0.600 |
1.111 |
0.850 |
|
|
0.830 |
0.700 |
1.370 |
0.900 |
|
|
1.080 |
0.800 |
1.667 |
0.940 |
|
|
1.300 |
0.850 |
1.889 |
0.960 |
|
|
1.700 |
0.900 |
2.000 |
0.970 |
|
|
2.300 |
0.950 |
2.259 |
0.980 |
|
|
2.830 |
0.980 |
2.630 |
0.990 |
|
|
3.400 |
1.000 |
3.370 |
1.000 |
|
|
~ |
1.000 |
9.000 |
1.001 |
|
|
|
|
18.000 |
1.167 |
|
|
|
|
27.000 |
1.267 |
|
|
|
|
36.000 |
1.325 |
|
|
|
|
45.000 |
1.358 |
|
|
|
|
54.000 |
1.375 |
|
|
|
|
63.000 |
1.390 |
|
|
|
|
~ |
1.390 |
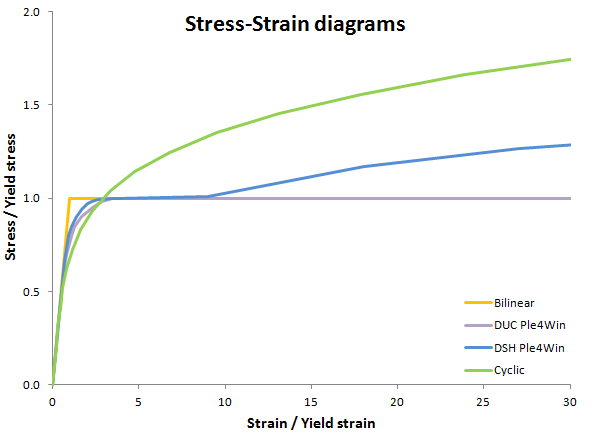
The above diagram shows the various built in (dimensionless) stress-strain relations (yield-strain = Re/Emod). The following diagram shows various stress-strain relations for a specific situation:

The Hutchinson & Miles and Ramberg & Osgood curves are frequently occurring stress-strain relations in literature.
They can be modelled in PLE too by using the 'Cyclic' option with the appropriate parameters K' en n'.
The MATCON curve shows the stress-strain relation of the material used for an in-plane bending test with soil pressure simulation by TNO.
H310181 (last modified: Feb 27, 2026)
See also: