Single Graph

Contents
This tool allows users to generate graphs within the workspace panel by utilizing data columns from a specified table. Depending on the selected table, the tool will automatically create either an orthogonal graph or a polar graph. If the first column in the table represents a circumferential angle, a polar graph will be produced; otherwise, an orthogonal graph will be generated.
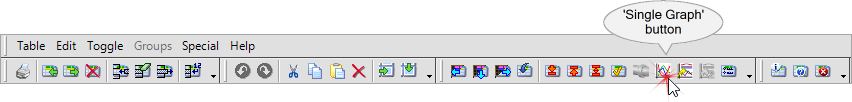
To create a graph, first select the desired data columns, then click the 'Single Graph' ![]() button located on the data table's toolbar.
button located on the data table's toolbar.
Single_Graph (last modified: Oct 23, 2024)
See also: