This chapter provides descriptions and instructions on how to use the graph drawing functionality of PLE using data from one single data table.
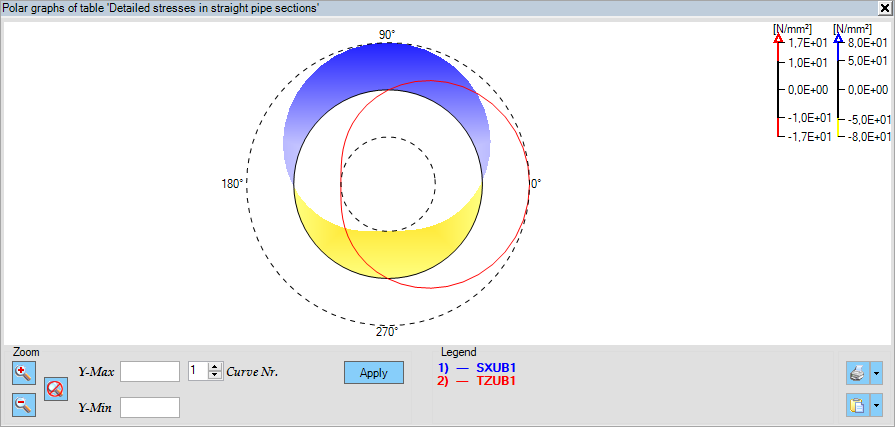
In the , the values from the selected columns will be represented around the circumference of a pipe cross-section.

An example of a polar graph showing the Von Mises stresses along the circumference of a pipe cross-section
 When the first column of the selected table for graph creation is labelled 'Angle', the graph will automatically be generated as a polar plot. The 'Angle' column represents the circumferential angles of a pipe cross-section. Data tables related to the pipe cross-section can be found in the additional output data tables.
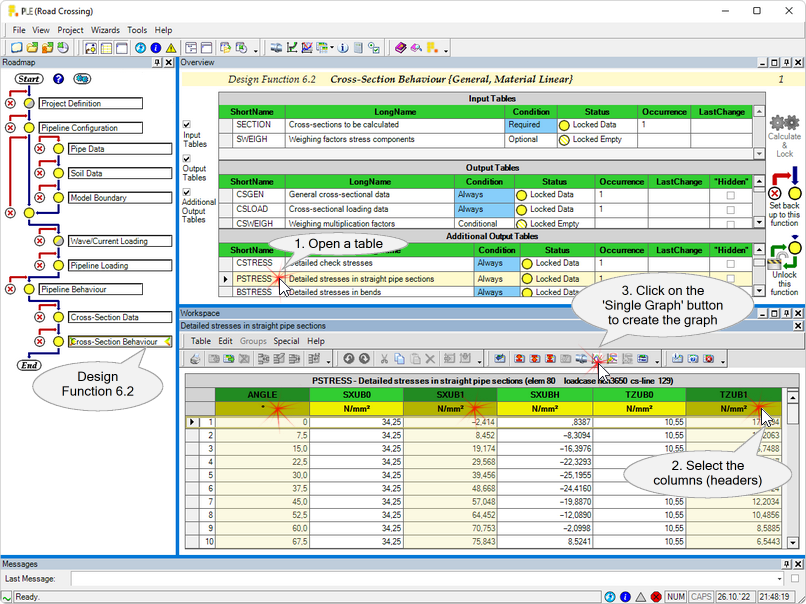
1.Open a data table (for example additional output table 'PSTRESS' from Design Function 6.2).
2.Select at least 1 or more columns from this table.
3.Click on the 'Single Graph'  button (on the toolbar of the data table) to add the selected data columns to the Single Graph and subsequently create the graph. button (on the toolbar of the data table) to add the selected data columns to the Single Graph and subsequently create the graph.
Columns can be selected by clicking, Shift+clicking and/or Ctrl+clicking.
In a circumferential-based table as table PSTRESS shown above, the values in the ANGLE column will appear along the X-axis. It is not required to explicitly select this ANGLE column. However, you must select at least one additional column, and the data from all selected columns will be used as Y-axis.
The Polar Graph panel will appear as a new tab in the workspace.
|
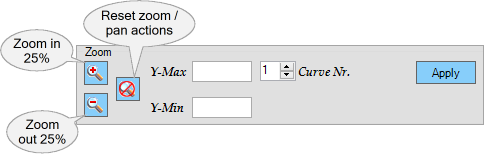
There are several ways to zoom and pan the graph:
To zoom in/out by 25%
|
Click the  or or  button. button.
Using this method, the aspect ratio of the graph is locked.
|
To exactly define the boundaries
of the graph shown
|
Values can be entered in the Ymin or Ymax textboxes. Empty textboxes leave that limit as-is.
Note that the y-axis limits have to be entered for each curve individually.
Using this method, the aspect ratio of the graph is not locked.
|
To reset all zoom or pan actions
|
Click the  button. button.
|
Should the drawing appear garbled, a double-click on the graphs-area will redraw it.
|
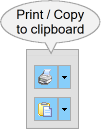
 Print graph Print graph
|
Click to print the single-table polar graph drawing.
Click on the down-arrow to show a submenu containing the following choices:

Print
|
The print dialog box pops up.
|
Print to File
|
The print to file dialog box pops up.
|
|
 Copy graph to clipboard Copy graph to clipboard
|
Click to copy the single-table polar graph drawing to the clipboard.
Click on the down-arrow to show a submenu containing the following choices:
.png)
Copy to Clipboard
|
Copies the single-table polar graph drawing to the clipboard.
|
Export as WMF-file
|
Opens the save file dialog to save the single-table polar graph drawing in the Windows Meta File format.
|
Export as PNG-file
|
Opens the save file dialog to save the single-table polar graph drawing as a PNG.
|
|
|
SinglePolarGraph (last modified: Mar 3, 2026)
See also:
Single (axial) Graph
Multi Graph
Pipeline View