Workspace Panel

Contents
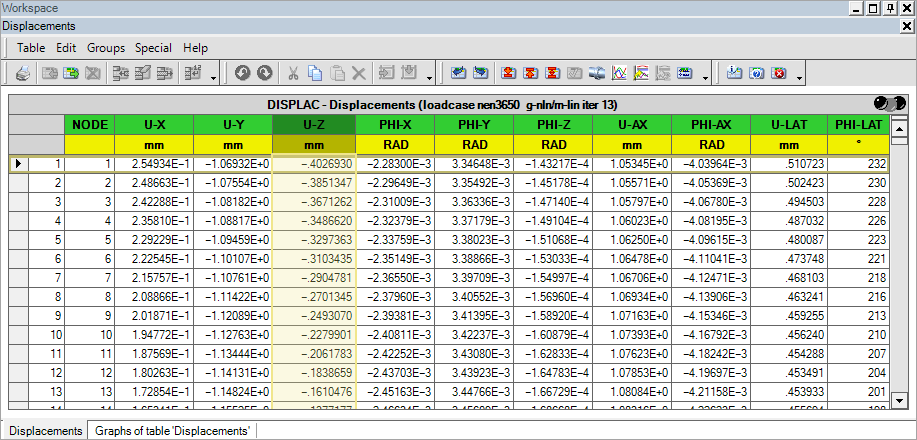
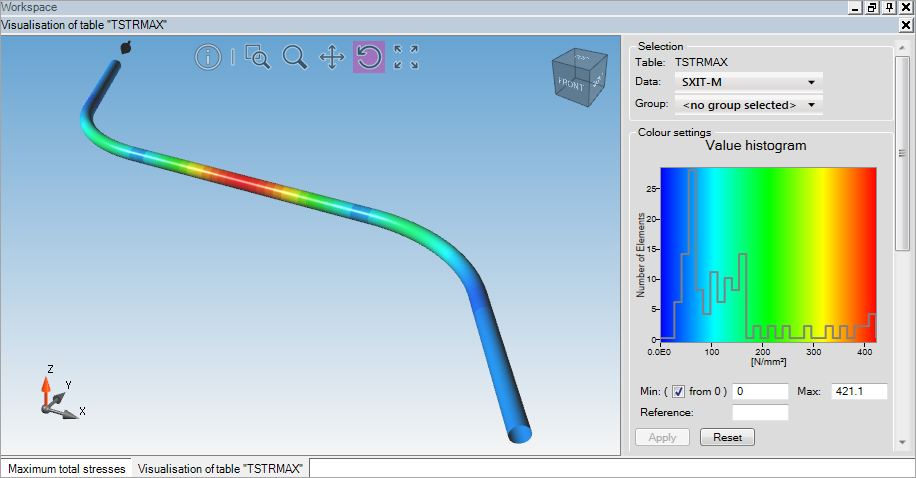
This area of the main screen is used to display data tables, single-table graphs, multi graph drawings, pipeline drawings and (data) visualisations.
A screenshot of the workspace panel having a data table, a single-table graph, a multi graph and a visualisation opened can be found below. Mark the tabs at the bottom of the workspace panel.


Workspace, last changed: 10/11/2022
See also: